When cash goes missing in a retail store, you count the stock. But how do you catch a thief in a service business where the "product" disappears the moment it is sold?
This is the story of how I used Linear Regression and simple utility bills to uncover a revenue leakage scheme that was costing a business owner over PKR 250,000 annually. No CCTV cameras, just pure data logic.
Key Takeaways
- The Problem: Service businesses (Laundry, Car Wash) lack physical inventory, making theft detection difficult.
- The Solution: Using "Electricity Consumption" as a proxy variable for business activity.
- The Result: Identified 45 days of unrecorded revenue and recovered 20% of lost income.
1. The "Invisible" Inventory Problem
My client runs a commercial laundry setup in Lahore. Despite having a steady stream of customers, his monthly revenue was volatile. Staff excuses ranged from "Load shedding" to "Low demand."
In a grocery store (like Jalal Sons), if I sell a Coke and pocket the cash, the inventory system shows -1 Bottle. The gap is visible. But in a laundry, once the shirt is washed and returned, the evidence vanishes.
2. The Hypothesis: Physics Doesn't Lie
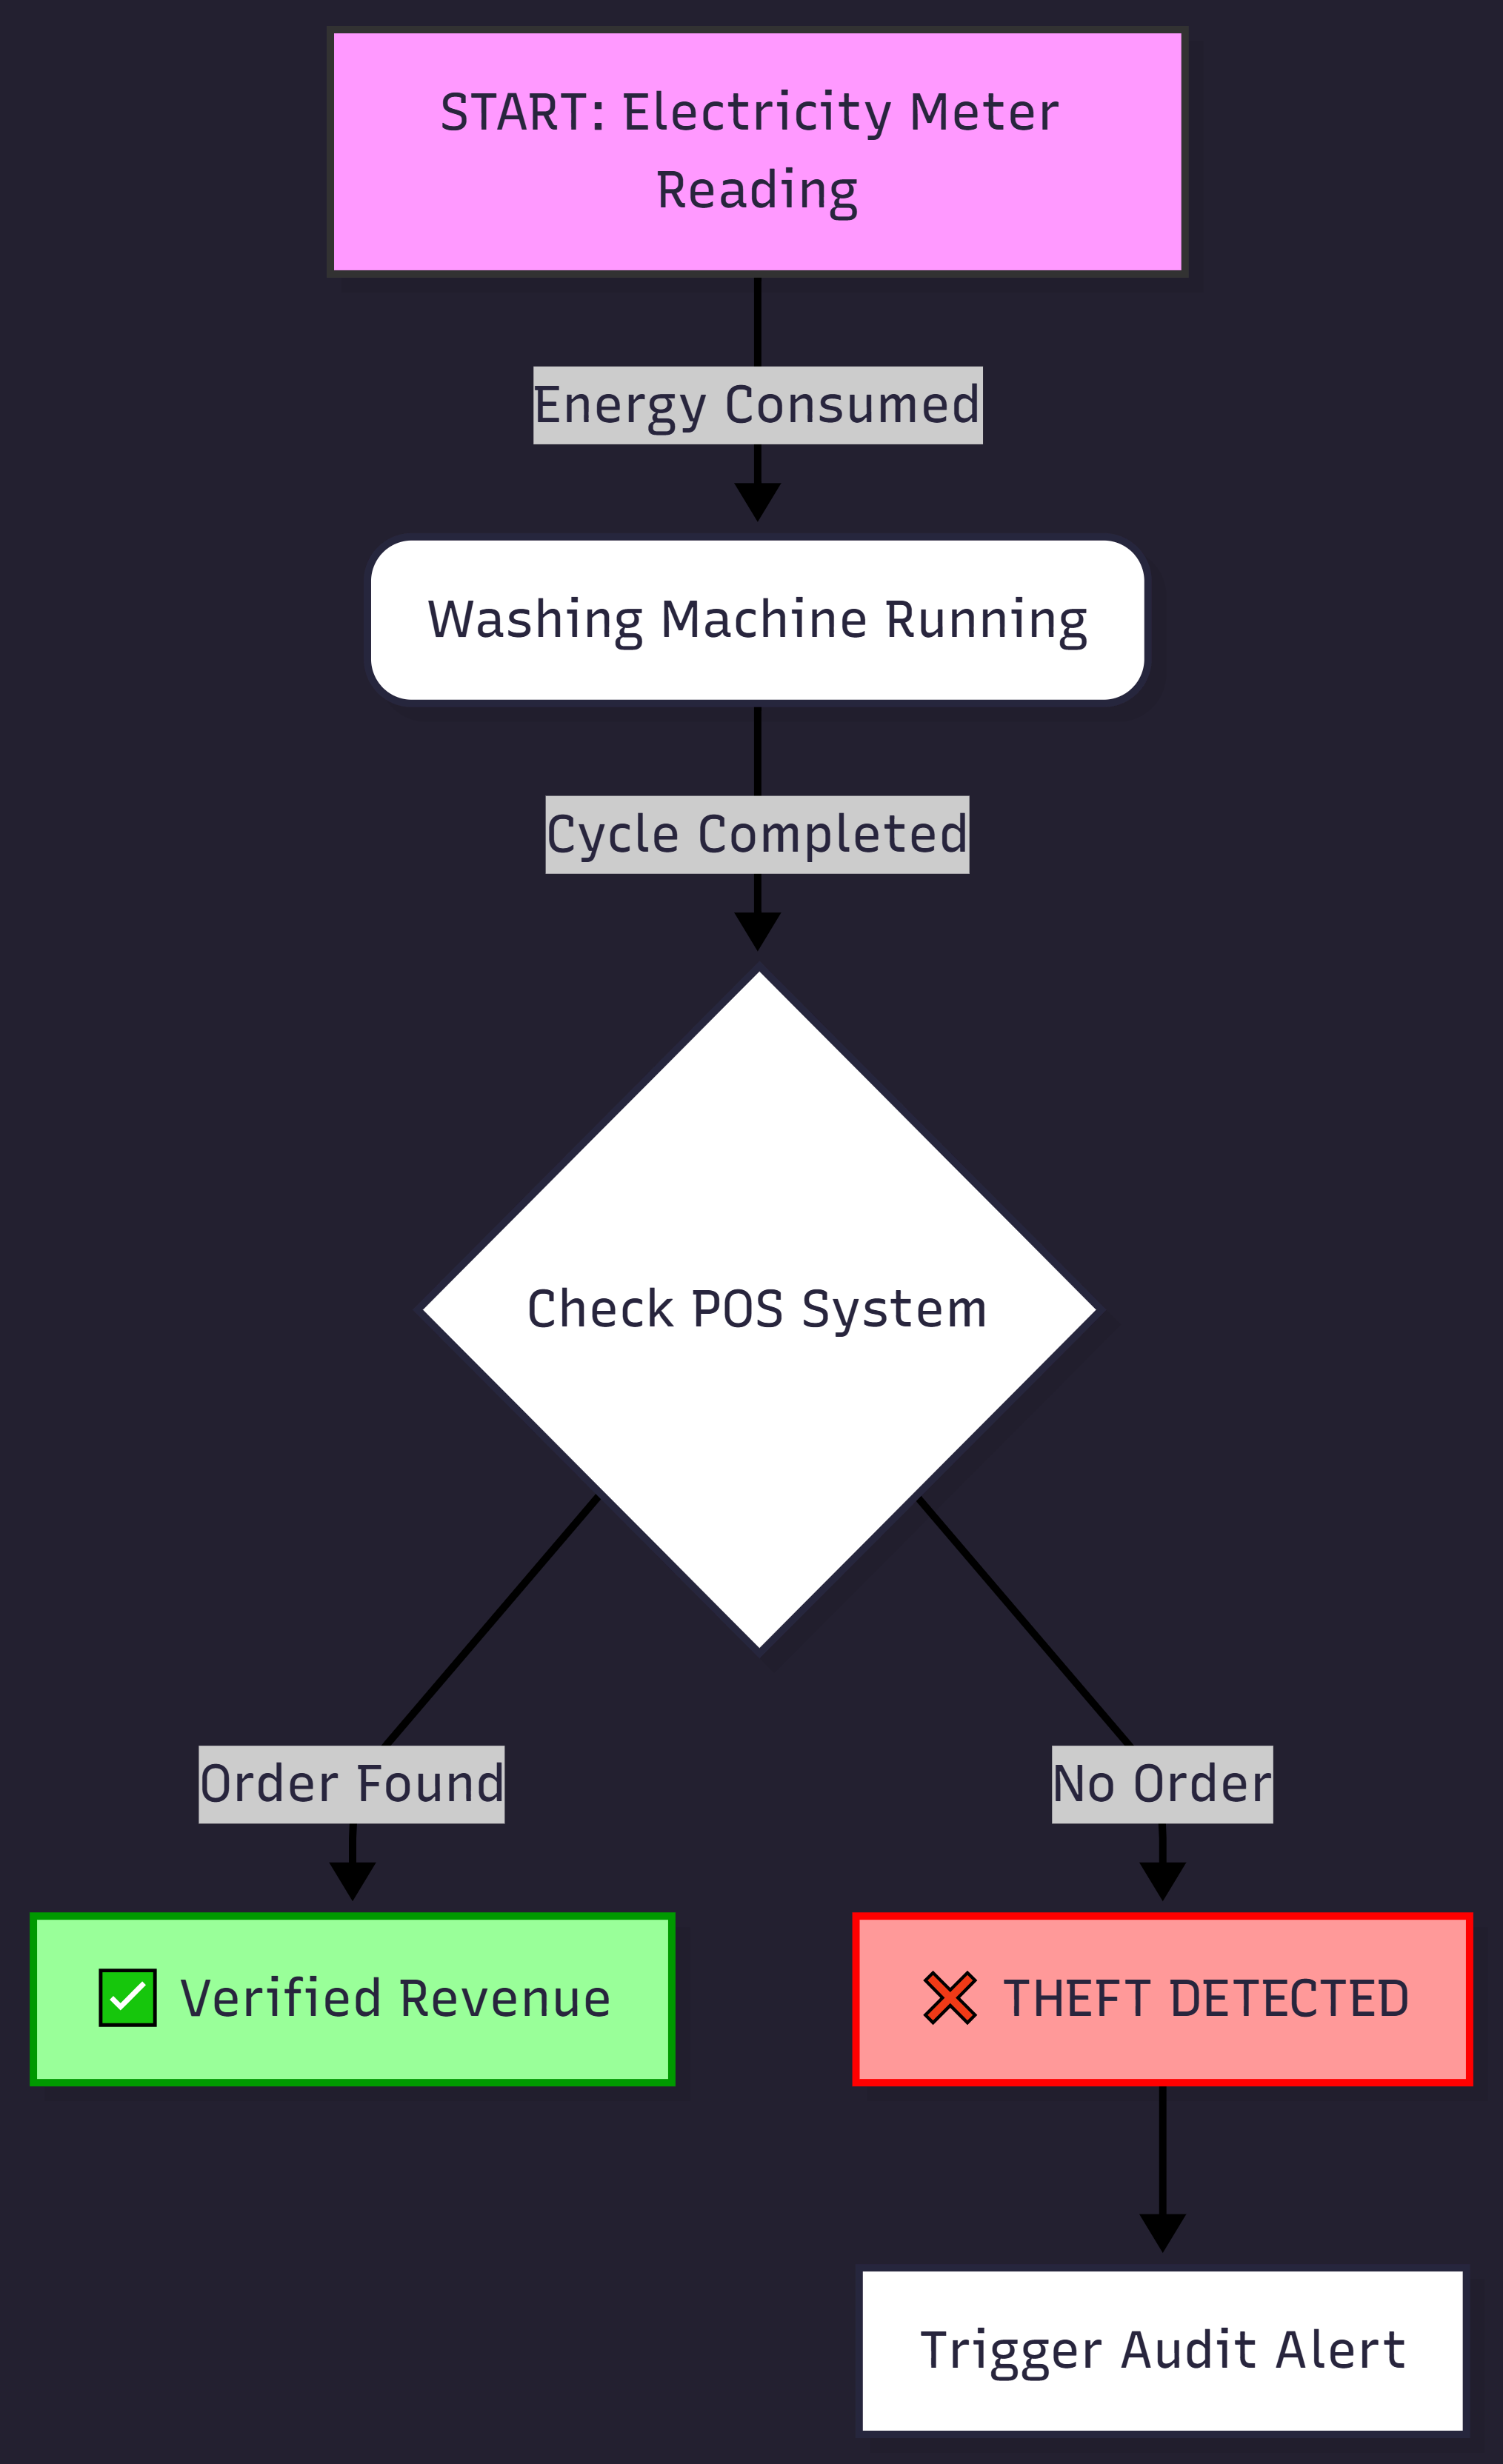
I realized that while staff can manipulate the POS (Point of Sale) system, they cannot manipulate the Laws of Physics.
A heavy-duty washing machine requires a specific amount of energy (kWh) to run a cycle.
Therefore:
If Electricity is consumed -> A Machine is Running -> An Order MUST be booked.
3. Data Analysis Methodology
I extracted two datasets for the last 6 months:
- Utility Data: Daily Meter Readings (Opening & Closing units).
- Sales Data: Daily Order Volume from the SQL Database.
Using R Programming, I plotted a scatter graph to check the correlation.
# R Code used for Linear Regression
library(ggplot2)
library(dplyr)

# Calculating Correlation
model <- lm(Total_Orders ~ Units_Consumed, data = laundry_data)
summary(model)

# Plotting the residuals (Theft Detection)
ggplot(laundry_data, aes(x=Units_Consumed, y=Total_Orders)) +
  geom_point() +
  geom_smooth(method='lm', color='red')
4. The "Smoking Gun" (Results)
The analysis revealed a clear baseline: 1 Order ≈ 1.5 Units of Electricity.
However, we found significant outliers. On January 12th, for example, the meter showed 48 Units consumed, but the system showed only 6 Orders.
Mathematically, this meant:
Expected Orders = 48 / 1.5 = 32 Orders
Actual Orders = 6
Missing Orders = 26 (Stolen Revenue)
5. Conclusion & Business Impact
Armed with this data, the owner confronted the staff. They confessed to washing clothes for friends and pocketing cash for "Urgent" orders without entering them in the system.
This audit proves that Data Science is not just for Tech Companies. Even a small laundry shop can save lacks of rupees by looking at the right numbers.

About the Author
Zubair Afzal | Procurement Officer & Data Scientist
I specialize in finding patterns in chaos. Currently optimizing supply chains at Jalal Sons using R, Python, and Common Sense. Connect on LinkedIn.